Azure Native Qumulo Now available in the EU, UK, and Canada – Learn More
Analytics — capacity explorer
Analytics — capacity trends
Analytics — integrated analytics
Analytics — IOPS hot spots
Analytics —Throughput hot spots
Analytics activity by path
Analytics activity by client
Continuous replication
Configure the network for static addresses
Create a Qumulo cluster on a Mac
Create a Qumulo cluster on Windows
Create a quota
Create an NFS export
Create an SMB share
Creating snapshots using the Qumulo dashboard
Safe shutdown
Scripting Qumulo with S3 via Minio
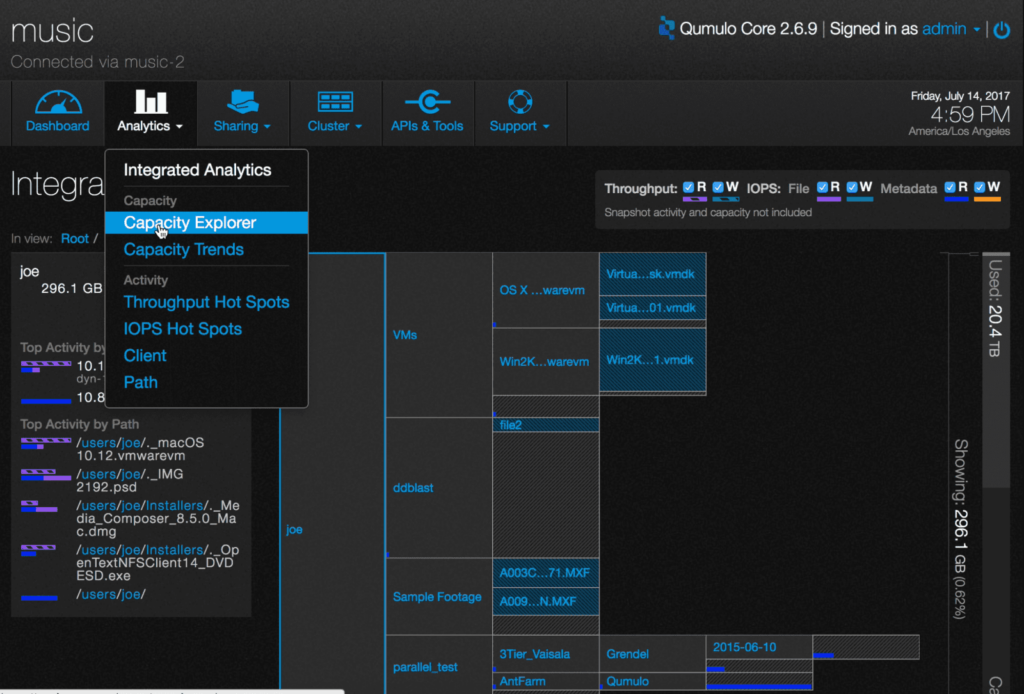
Analytics lets you see how capacity is used on your system.
1. On the main dashboard, point to Analytics and click Capacity Explorer.
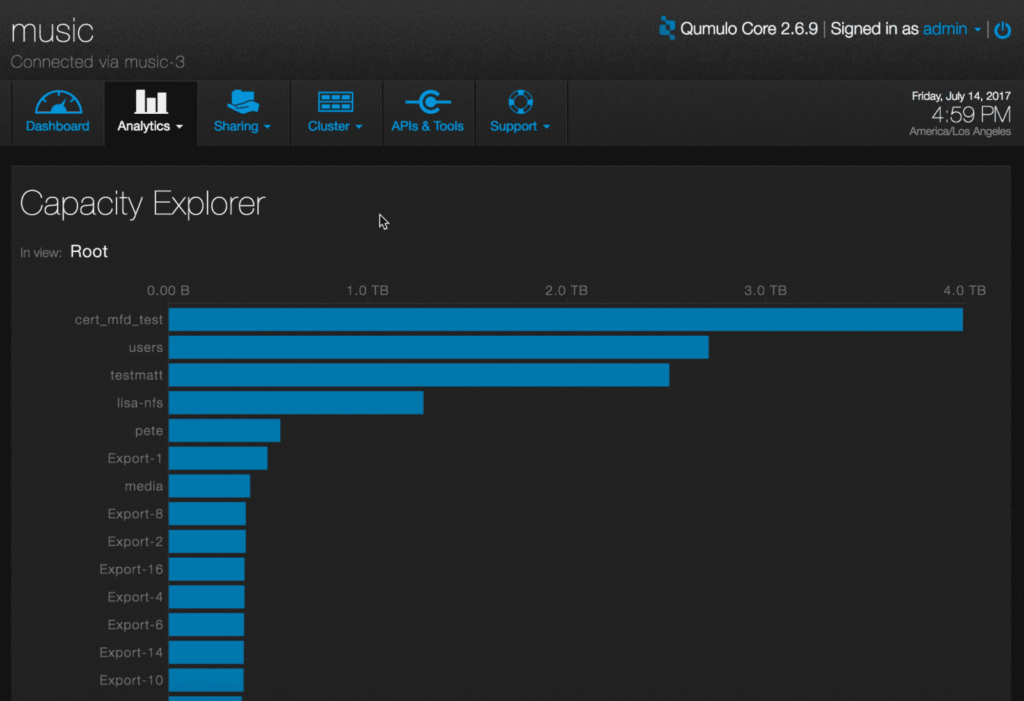
2. The lower window changes to a hierarchical view of capacity.
The directories are listed from largest to smallest.
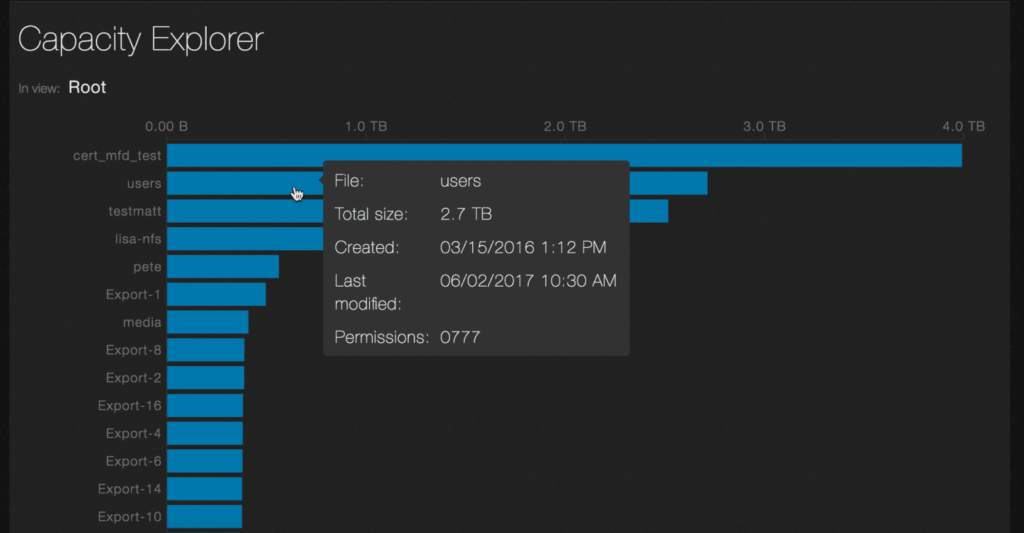
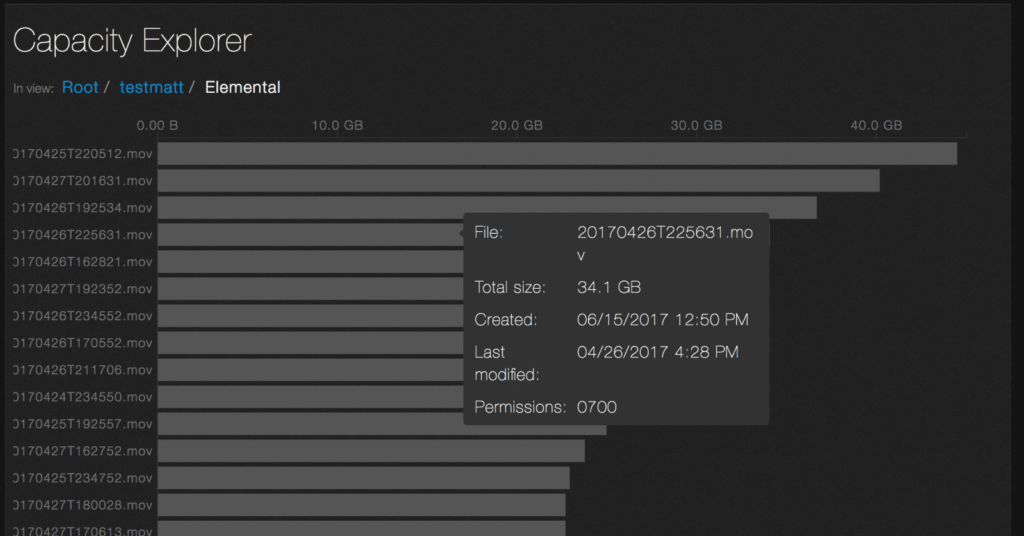
3. To see file system details, hover over a directory with the mouse.
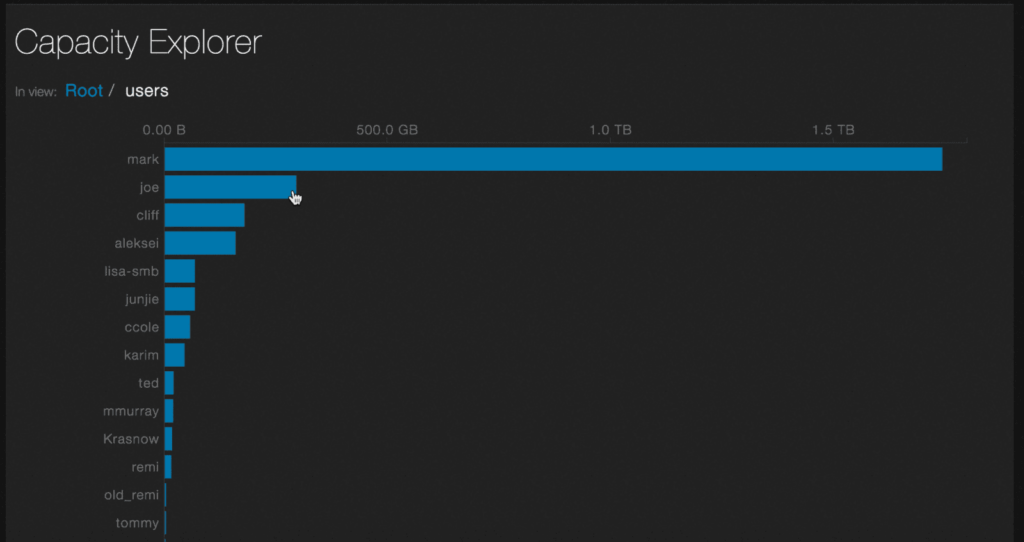
4. Click on a directory. The bar graph expands with information about the files it contains. In this example, the screenshot shows the subdirectories contained in the directory named users.
5. You can continue to click on directories until you ultimately reach detail at the file level.