
Azure Native Qumulo Now available in the EU, UK, and Canada – Learn More
Analytics — capacity explorer
Analytics — capacity trends
Analytics — integrated analytics
Analytics — IOPS hot spots
Analytics —Throughput hot spots
Analytics activity by path
Analytics activity by client
Continuous replication
Configure the network for static addresses
Create a Qumulo cluster on a Mac
Create a Qumulo cluster on Windows
Create a quota
Create an NFS export
Create an SMB share
Creating snapshots using the Qumulo dashboard
Safe shutdown
Scripting Qumulo with S3 via Minio
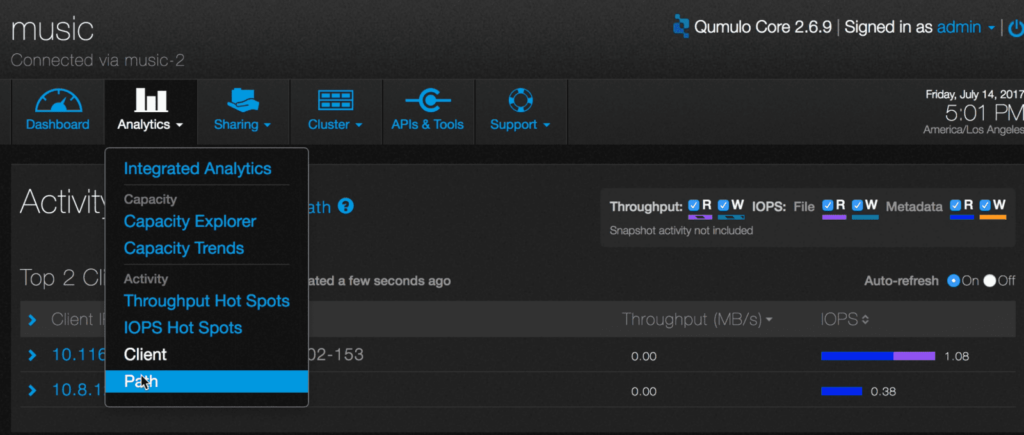
Analytics lets you see which paths are most active in terms of throughput and IOPS.
1. On the main dashboard, point to Analytics and click Path.
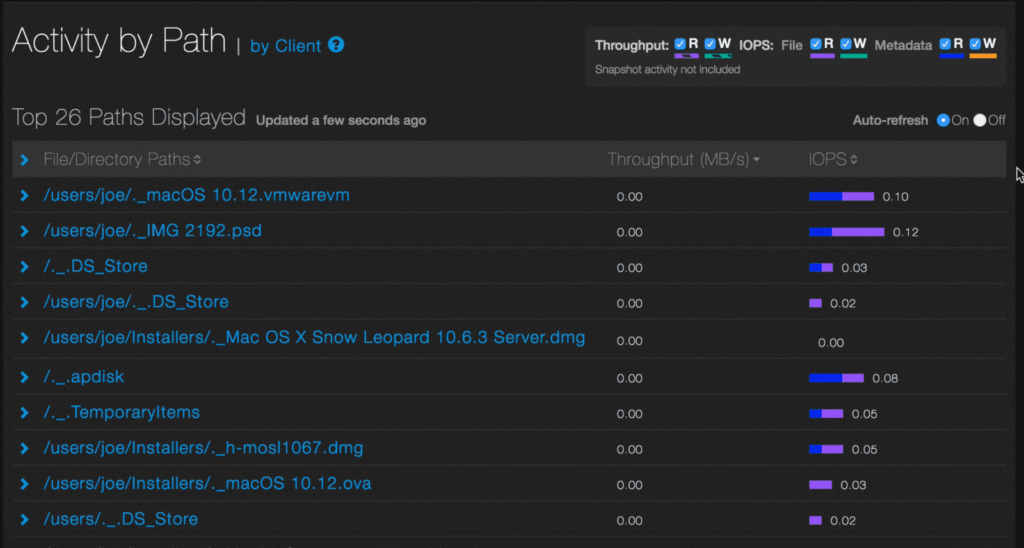
2. You will see a list of up to 40 of the most active paths in terms of throughput and IOPS. Here is an example.
For throughput, read operations are displayed as a striped purple bar and write operations as a striped green bar. For IOPS, read operations are displayed as a solid purple bar and write operations as a solid green bar. For metadata, read operations are displayed as a solid blue bar and write operations as a solid orange bar.
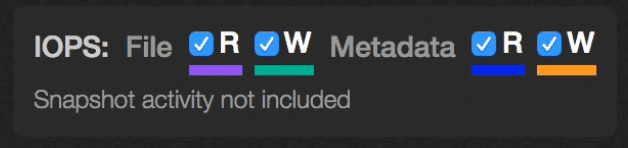
3. Each component can be independently selected by checking the corresponding buttons near the top of this display pane. In this example, all the components are selected.
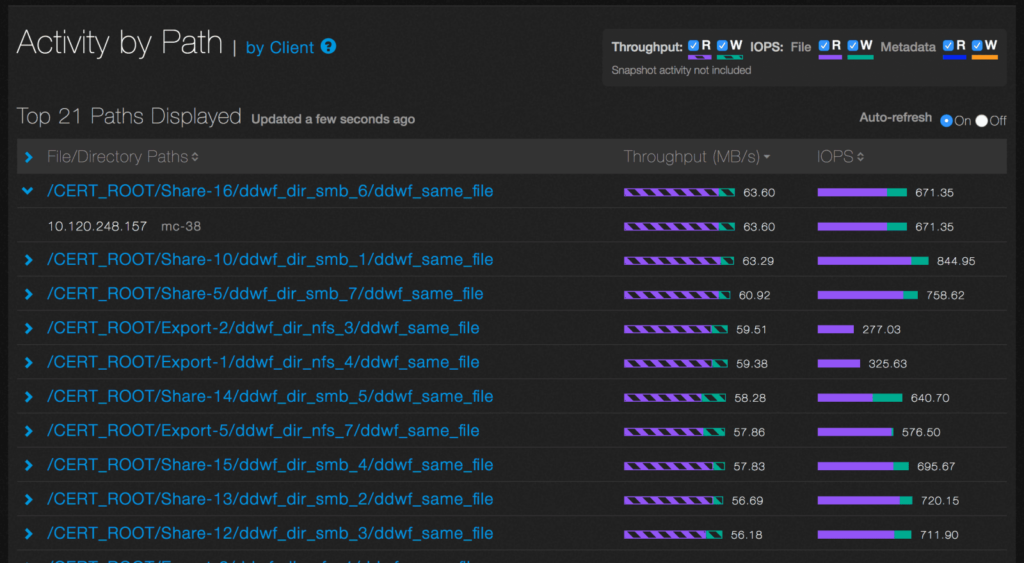
4. Click on a path to see the active client’s IP address and DNS name.
In this example, for the path, /CERT_ROOT/Share-16/ddwf_dir_smb_6/ddwf_same_file, the client at IP address 10.120.248.157 (mc-38), is the most active.
5. By default, File/Directory Paths, Throughput, and IOPS are sorted in descending order, as shown in the example. You can toggle between descending and ascending order by clicking on the appropriate header.
6. To pause the display, select the Auto-refresh Off radio button.